|
UNITED STATES |
|
SECURITIES AND EXCHANGE COMMISSION |
|
|
|
Washington, D.C. 20549 |
|
|
|
|
|
FORM 8-K |
|
|
|
|
|
CURRENT REPORT |
|
Pursuant to Section 13 or 15(d) of |
|
the Securities Exchange Act of 1934 |
|
|
|
Date of Report (Date of earliest event reported) January 31, 2008 |
|
|
|
LEAR CORPORATION |
|
|
|
(Exact name of Registrant as specified in its charter) |
|
|
|
Delaware |
1-11311 |
13-3386776 |
|
(State or other |
(Commission File Number) |
(IRS Employer |
|
jurisdiction of |
|
Identification |
|
incorporation) |
|
Number) |
|
|
|
|
|
|
|
|
|
21557 Telegraph Road, Southfield, Michigan |
|
48033 |
|
(Address of principal executive offices) |
|
(Zip Code) |
|
|
|
|
|
|
(248) 447-1500 |
|
|
|
(Registrant’s telephone number, including area code) |
|
|
|
|
|
|
|
N/A |
|
|
|
|
|
|
|
(Former name or former address, if changed since last report) |
|
|
|
|
|
|
|
|
|
Check the appropriate box below if the Form 8-K filing is intended to simultaneously satisfy the filing obligation of the registrant under any of the following provisions:
|
o |
Written communications pursuant to Rule 425 under the Securities Act (17 CFR 230.425) |
|
o |
Soliciting material pursuant to Rule 14a-12 under the Exchange Act (17 CFR 240.14a-12) |
|
o |
Pre-commencement communications pursuant to Rule 14d-2(b) under the Exchange Act (17 CFR 240.14d-2(b)) |
|
o |
Pre-commencement communications pursuant to Rule 13e-4(c) under the Exchange Act (17 CFR 240.13e-4(c)) |
|
|
|
Lear Corporation (“Lear” or the “Company”) is filing this Form 8-K to (i) furnish information regarding Lear’s results of operations for the fourth quarter and full year of 2007, (ii) update Lear’s financial outlook for 2008 and (iii) supplement Lear’s Current Report on Form 8-K initially filed on June 27, 2005, as supplemented on August 30, 2005, January 25, 2006, October 26, 2006, January 11, 2007, January 25, 2007, April 25, 2007, August 2, 2007, November 6, 2007 and December 20, 2007, in order to update certain disclosures with respect to Lear’s restructuring strategy (the “Restructuring”).
FORWARD-LOOKING STATEMENTS
The Current Report on Form 8-K contains forward-looking statements within the meaning of the Private Securities Litigation Reform Act of 1995, including statements regarding anticipated financial results and liquidity. Actual results may differ materially from anticipated results as a result of certain risks and uncertainties, including but not limited to, general economic conditions in the markets in which the Company operates, including changes in interest rates or currency exchange rates, the financial condition of the Company’s customers or suppliers, fluctuations in the production of vehicles for which the Company is a supplier, changes in the Company’s current vehicle production estimates, the loss of business with respect to, or the lack of commercial success of, a vehicle model for which the Company is a significant supplier, disruptions in the relationships with the Company’s suppliers, labor disputes involving the Company or its significant customers or suppliers or that otherwise affect the Company, the Company’s ability to achieve cost reductions that offset or exceed customer-mandated selling price reductions, the outcome of customer productivity negotiations, the impact and timing of program launch costs, the costs, timing and success of restructuring actions, increases in the Company’s warranty or product liability costs, risks associated with conducting business in foreign countries, competitive conditions impacting the Company’s key customers and suppliers, the cost and availability of raw materials and energy, the Company’s ability to mitigate any increases in raw material, energy and commodity costs, the outcome of legal or regulatory proceedings to which the Company is or may become a party, unanticipated changes in cash flow, including the Company’s ability to align its vendor payment terms with those of its customers and other risks described from time to time in the Company’s Securities and Exchange Commission filings. In particular, the Company’s financial outlook for 2008 is based on several factors, including the Company’s current vehicle production and raw material pricing assumptions. The Company’s actual financial results could differ materially as a result of significant changes in these factors.
The forward-looking statements in this Current Report on Form 8-K are made as of the date hereof, and the Company does not assume any obligation to update, amend or clarify them to reflect events, new information or circumstances occurring after the date hereof.
Section 2 – Financial Information
Item 2.02 Results of Operations and Financial Condition.
The following information is provided pursuant to Item 2.02 of Form 8-K, “Results of Operations and Financial Condition,” and Item 7.01 of Form 8-K, “Regulation FD Disclosure.”
On January 31, 2008, Lear Corporation issued a press release reporting its financial results for the fourth quarter and full year of 2007 and updating its financial outlook for 2008. A copy of the press release is attached hereto as Exhibit 99.1 and incorporated by reference herein.
On January 31, 2008, Lear Corporation made available the presentation slides attached hereto as Exhibit 99.2 in a webcast of its fourth quarter and full year 2007 earnings call. Exhibit 99.2 is incorporated by reference herein.
2
The information contained in Exhibits 99.1 and 99.2 shall not be deemed “filed” for purposes of Section 18 of the Securities Exchange Act of 1934, as amended (the “Exchange Act”), or incorporated by reference in any filing under the Securities Act of 1933, as amended, or the Exchange Act, except as shall be expressly set forth by specific reference in such a filing.
Item 2.05 Costs Associated with Exit or Disposal Activities.
As part of its previously announced Restructuring, Lear has continued consolidation, facility realignment and census actions. In 2007, these actions resulted in net charges of $181.8 million, consisting of employee termination costs of $115.5 million, fixed asset impairment charges of $16.8 million, contract termination costs of $24.8 million (including net pension and other postretirement benefit plan curtailment losses of $18.8 million) and other costs of $24.7 million (including $13.0 million of estimated manufacturing inefficiency costs resulting from the Restructuring). The severance and other incremental costs represent cash charges, while the asset impairment charges represent non-cash charges. Cash payments related to the Restructuring totaled $111.4 million in 2007.
Through December 31, 2007, the Company has incurred costs of approximately $385.9 million in connection with the Restructuring. Approximately 90% of the restructuring costs will result in cash expenditures.
Item 2.06 Material Impairments.
The information set forth under Item 2.05 relating to impairment charges is incorporated herein by reference.
Section 7 – Regulation FD
Item 7.01 Regulation FD Disclosure.
See “Item 2.02 Results of Operations and Financial Condition” above.
Section 9 – Financial Statements and Exhibits
ITEM 9.01 FINANCIAL STATEMENTS AND EXHIBITS.
|
(d) |
Exhibits |
|
|
|
|
|
|
99.1 |
Press release issued January 31, 2008, furnished herewith. |
|
|
|
|
|
|
99.2 |
Presentation slides from the Lear Corporation webcast of its fourth quarter and full year 2007 earnings call held on January 31, 2008, furnished herewith. |
|
3
SIGNATURES
Pursuant to the requirements of the Securities Exchange Act of 1934, the registrant has duly caused this report to be signed on its behalf by the undersigned thereunto duly authorized.
|
|
|
|
||
|
|
|
Lear Corporation |
||
|
|
|
|
||
|
|
|
|
||
|
Date: January 31, 2008 |
|
By: |
/s/ Matthew J. Simoncini |
|
|
|
|
|
|
|
|
|
|
Name: |
Matthew J. Simoncini |
|
|
|
|
Title: |
Senior Vice President and |
|
4
EXHIBIT INDEX
|
Exhibit No. |
|
Description |
|
|
|
|
|
|
|
|
|
|
||
|
|
|
|
|
|
5
Exhibit 99.1
|
FOR IMMEDIATE RELEASE |
|
|
Investor Relations: |
|
|
Mel Stephens |
|
|
(248) 447-1624 |
Media:
Andrea Puchalsky
|
|
(248) 447-1651 |
Lear Reports Improved Fourth-Quarter and Full-Year 2007 Results and Updates 2008 Financial Outlook
SOUTHFIELD, Mich., January 31, 2008 -- Lear Corporation [NYSE: LEA], one of the world’s largest suppliers of automotive seating systems, electrical distribution systems and electronic products, today reported improved financial results for the fourth quarter and full year 2007 compared with year-ago levels and updated its financial outlook for 2008.
Fourth-Quarter and Full-Year 2007 Highlights:
|
|
§ |
Net sales in core businesses up 6% in Q4 and 5% for FY vs. year ago |
|
|
§ |
Core operating earnings up 11% in Q4 and 34% for FY vs. year ago |
|
|
§ |
Free cash flow of $434 million for full year – best since 2003 |
|
|
§ |
Continued to diversify sales – about 60% of revenue outside of N.A. in Q4 |
|
|
§ |
Aggressive actions taken to improve cost structure since 2005 |
|
|
§ |
ProTec™ PluS named finalist in 2008 Automotive News PACE Awards |
For the fourth quarter of 2007, Lear reported net sales of $3.9 billion and pretax income of $45.1 million, including restructuring costs and other special items of $94.9 million. This compares with net sales of $4.3 billion and a pretax loss of $635.9 million for the fourth quarter of 2006, including a loss of $607.3 million related to the divestiture of the Interior business and restructuring costs and other special items of $91.8 million.
Income before interest, other (income) expense, income taxes, restructuring costs and other special items (core operating earnings) was $178.6 million in the fourth quarter of 2007. This compares with core operating earnings of $161.1 million in the fourth quarter of 2006, excluding the divested Interior business. A reconciliation of core operating earnings to pretax income (loss) as determined by generally accepted accounting principles is provided in the supplemental data pages.
.
“We have been successful in restructuring our operations to achieve improved financial results at lower production levels,” said Lear Chairman, CEO and President Bob Rossiter. “We remain committed to continuously improving the fundamentals of our business – quality, customer satisfaction, innovation and cost structure. Going forward, the Lear team is focused on profitably growing and further improving the long-term competitiveness of our seating and electrical and electronic businesses.”
For the fourth quarter of 2007, net sales in Lear’s core businesses were up over $200 million from the prior year, primarily reflecting favorable foreign exchange and the addition of new business outside of North America, offset in part by unfavorable platform mix in North America. Operating performance improved from the year-earlier results, reflecting the Company’s cost improvement actions and restructuring initiative, as well as benefits from new business outside of North America.
In the seating segment, operating margins were unchanged from a year ago, reflecting favorable cost performance from restructuring and ongoing efficiency actions, selective vertical integration and the benefit of new business globally, offset by unfavorable platform mix in North America. In the electrical and electronic segment, operating margins improved slightly reflecting the favorable impact of net commodity costs.
Lear reported fourth-quarter 2007 net income of $27.0 million, or $0.34 per share, including restructuring costs and other special items. This compares with a net loss of $645.0 million, or $8.90 per share, including restructuring costs and other special items, for the fourth quarter of 2006.
Free cash flow in the fourth quarter of 2007 was $170.9 million, compared with $254.4 million in the fourth quarter of 2006. The lower cash flow reflects primarily the timing of engineering and tooling recoveries. (Net cash provided by operating activities was $157.4 million and $179.2 million in the fourth quarters of 2007 and 2006, respectively. A reconciliation of free cash flow to net cash provided by operating activities is provided in the supplemental data pages.)
Also during the fourth quarter, Lear’s ProTec™ PluS self-aligning active head restraint system was selected as a finalist and Lear’s SoyFoam™ received honorable mention in the 14th annual PACE (Premier Automotive Suppliers’ Contribution to Excellence) Award competition, which is jointly presented by Automotive News, Microsoft, SAP and Transportation Research Center Inc.
2007 Full-Year Results
For the full year 2007, Lear reported net sales of $16.0 billion and pretax income of $331.4 million, including restructuring costs and other special items of $204.9 million. This compares with net sales of $17.8 billion and a pretax loss of
2
$655.5 million, including restructuring costs and other special items of $770.2 million, for the full year 2006.
Full-year 2007 net sales in core businesses were $15.3 billion, up about $700 million from 2006, reflecting the addition of new business primarily outside of North America and favorable foreign exchange, offset by lower industry production and unfavorable platform mix in North America.
Excluding the divested Interior business, income before interest, other expense, income taxes, restructuring costs and other special items (core operating earnings) was $748.5 million in 2007, compared with $557.8 million in 2006. The improvement reflects favorable cost performance from restructuring and ongoing efficiency actions, selective vertical integration and the benefit of new business, partially offset by lower industry production and unfavorable platform mix in North America. A reconciliation of core operating earnings to pretax income (loss) as determined by generally accepted accounting principles is provided in the supplemental data pages.
“We have seen promising results from our strategy to restructure our global operations, deliver superior quality products and service, encourage innovation and continue to diversify our sales on a customer, regional and vehicle segment basis,” Rossiter continued.
Lear reported net income of $241.5 million, or $3.09 per share, including restructuring costs and other special items, for the full-year 2007. This compares with a net loss of $707.5 million, or $10.31 per share, including special items, for the full-year 2006. Lear’s 2007 net income excluding restructuring costs and other special items (adjusted net income) was $409.6 million, or $5.24 per share. A reconciliation of adjusted net income to net income as determined by generally accepted accounting principles is provided in the supplemental data pages.
Free cash flow in 2007 was $433.6 million. This compares with free cash flow of $115.7 million in 2006. The improvement reflects higher earnings and the divestiture of the Interior business. (Net cash provided by operating activities was $466.9 million and $285.3 million in 2007 and 2006, respectively. A reconciliation of free cash flow to net cash provided by operating activities is provided in the supplemental data pages.)
Lear continued to diversify its sales, with about 60% of revenue in the fourth quarter and 55% of revenue in the full year generated outside of North America. Lear also continued to improve its business structure by implementing $386 million in global restructuring actions since 2005.
2008 Full-Year Outlook
Summarized below is our 2008 financial outlook. Lear expects 2008 worldwide net sales of approximately $15 billion, reflecting primarily the addition of
3
new business globally and the positive impact of foreign exchange, more than offset by lower vehicle production and unfavorable platform mix in North America.
Lear anticipates 2008 income before interest, other expense, income taxes, restructuring costs and other special items (core operating earnings) of $660 to $700 million. Restructuring costs in 2008 are estimated to be about $100 million.
Interest expense for 2008 is estimated to be between $185 and $195 million. Pretax income before restructuring costs and other special items is estimated to be in the range of $430 to $470 million. Tax expense is expected to be approximately $135 million, depending on the mix of earnings by country.
Capital spending in 2008 is estimated in the range of $255 to $275 million. Depreciation and amortization expense is estimated at about $300 million. Free cash flow is expected to be solidly positive, at $250 million or more, for the year.
Key assumptions underlying Lear’s financial outlook include expectations for industry vehicle production of approximately 14.4 million units in North America and 20.1 million units in Europe. Lear expects production for the Domestic Three to be down about 9% in North America. In addition, we are assuming an exchange rate of $1.45/Euro.
Lear will webcast its fourth-quarter earnings conference call through the Investor Relations link at http://www.lear.com at 9:00 a.m. EST. In addition, the conference call can be accessed by dialing 1-800-789-4751 (domestic) or 1-706-679-3323 (international). The audio replay will be available two hours following the call at 1-800-642-1687 (domestic) or 1-706-645-9291 (international) and will be available until February 10, 2008, with a Conference I.D. of 27464814. Interested parties may also listen to the live audio webcast of the call, in listen-only mode, on the corporate website at http://www.lear.com.
Non-GAAP Financial Information
In addition to the results reported in accordance with accounting principles generally accepted in the United States (“GAAP”) included throughout this press release, the Company has provided information regarding “income before interest, other (income) expense, income taxes, restructuring costs and other special items, excluding the divested Interior business” (core operating earnings), “pretax income before restructuring costs and other special items”, “net income excluding restructuring costs and other special items” (adjusted net income) and “free cash flow” (each, a non-GAAP financial measure). Other (income) expense includes, among other things, state and local non-income taxes, foreign exchange gains and losses, fees associated with the Company’s asset-backed securitization and factoring facilities, minority interests in consolidated subsidiaries, equity in net income of affiliates and gains and losses on the sale of assets. Free cash flow represents net cash provided by operating activities before the net change in sold accounts receivable, less capital expenditures. The Company believes it is
4
appropriate to exclude the net change in sold accounts receivable in the calculation of free cash flow since the sale of receivables may be viewed as a substitute for borrowing activity.
Management believes the non-GAAP financial measures used in this press release are useful to both management and investors in their analysis of the Company’s financial position and results of operations. In particular, management believes that core operating earnings, pretax income before restructuring costs and other special items and adjusted net income are useful measures in assessing the Company’s financial performance by excluding certain items (including those items that are included in other expense) that are not indicative of the Company’s core operating earnings or that may obscure trends useful in evaluating the Company’s continuing operating activities. Management also believes that these measures are useful to both management and investors in their analysis of the Company’s results of operations and provide improved comparability between fiscal periods. Management believes that free cash flow is useful to both management and investors in their analysis of the Company’s ability to service and repay its debt. Further, management uses these non-GAAP financial measures for planning and forecasting in future periods.
Core operating earnings, pretax income before restructuring costs and other special items, adjusted net income and free cash flow should not be considered in isolation or as a substitute for pretax income (loss), net income (loss), cash provided by operating activities or other income statement or cash flow statement data prepared in accordance with GAAP or as a measure of profitability or liquidity. In addition, the calculation of free cash flow does not reflect cash used to service debt and therefore, does not reflect funds available for investment or other discretionary uses. Also, these non-GAAP financial measures, as determined and presented by the Company, may not be comparable to related or similarly titled measures reported by other companies.
For reconciliations of non-GAAP financial measures to the most directly comparable financial measures calculated and presented in accordance with GAAP, see the supplemental data pages which, together with this press release, have been posted on the Company’s website through the Investor Relations link at http://www.lear.com. Given the inherent uncertainty regarding special items, other expense and the net change in sold accounts receivable in any future period, a reconciliation of forward-looking financial measures to the most directly comparable financial measures calculated and presented in accordance with GAAP is not feasible. The magnitude of these items, however, may be significant.
Forward-Looking Statements
This press release contains forward-looking statements within the meaning of the Private Securities Litigation Reform Act of 1995, including statements regarding anticipated financial results and liquidity. Actual results may differ materially from anticipated results as a result of certain risks and uncertainties,
5
including but not limited to, general economic conditions in the markets in which the Company operates, including changes in interest rates or currency exchange rates, the financial condition of the Company’s customers or suppliers, fluctuations in the production of vehicles for which the Company is a supplier, changes in the Company’s current vehicle production estimates, the loss of business with respect to, or the lack of commercial success of, a vehicle model for which the Company is a significant supplier, disruptions in the relationships with the Company’s suppliers, labor disputes involving the Company or its significant customers or suppliers or that otherwise affect the Company, the Company’s ability to achieve cost reductions that offset or exceed customer-mandated selling price reductions, the outcome of customer productivity negotiations, the impact and timing of program launch costs, the costs, timing and success of restructuring actions, increases in the Company’s warranty or product liability costs, risks associated with conducting business in foreign countries, competitive conditions impacting the Company’s key customers and suppliers, the cost and availability of raw materials and energy, the Company’s ability to mitigate any increases in raw material, energy and commodity costs, the outcome of legal or regulatory proceedings to which the Company is or may become a party, unanticipated changes in cash flow, including the Company’s ability to align its vendor payment terms with those of its customers and other risks described from time to time in the Company’s Securities and Exchange Commission filings. In particular, the Company’s financial outlook for 2008 is based on several factors, including the Company’s current vehicle production and raw material pricing assumptions. The Company’s actual financial results could differ materially as a result of significant changes in these factors.
The forward-looking statements in this press release are made as of the date hereof, and the Company does not assume any obligation to update, amend or clarify them to reflect events, new information or circumstances occurring after the date hereof.
Lear Corporation is one of the world’s largest suppliers of automotive seating systems, electrical distribution systems and electronics products. The Company’s world-class products are designed, engineered and manufactured by a diverse team of more than 90,000 employees at 236 facilities in 34 countries. Lear’s headquarters are in Southfield, Michigan, and Lear is traded on the New York Stock Exchange under the symbol [LEA]. Further information about Lear is available on the internet at http://www.lear.com.
6
Lear Corporation and Subsidiaries
Consolidated Statements of Operations
(In millions, except per share amounts)
|
|
|
|
|
Three Months Ended |
|
||||||
|
|
|
|
|
|
|
||||||
|
|
|
|
|
December 31, |
|
|
|
December 31, |
|
||
|
|
|
|
|
2007 |
|
|
|
2006 |
|
||
|
|
|
|
|
|
|
|
|
|
|
||
|
|
|
|
|
|
|
|
|
|
|
|
|
|
Net sales |
|
|
|
$ |
3,859.0 |
|
|
|
$ |
4,280.5 |
|
|
|
|
|
|
|
|
|
|
|
|
|
|
|
Cost of sales |
|
|
|
|
3,626.3 |
|
|
|
|
4,042.9 |
|
|
Selling, general and administrative expenses |
|
|
|
|
146.1 |
|
|
|
|
152.8 |
|
|
Divestiture of Interior business |
|
|
|
|
2.9 |
|
|
|
|
607.3 |
|
|
Interest expense |
|
|
|
|
48.9 |
|
|
|
|
52.3 |
|
|
Other (income) expense, net |
|
|
|
|
(10.3 |
) |
|
|
|
61.1 |
|
|
|
|
|
|
|
|
|
|
|
|
|
|
|
|
|
|
|
|
|
|
|
|
|
|
|
|
Income (loss) before income taxes |
|
|
|
|
45.1 |
|
|
|
|
(635.9 |
) |
|
Income tax provision |
|
|
|
|
18.1 |
|
|
|
|
9.1 |
|
|
|
|
|
|
|
|
|
|
|
|
|
|
|
Net income (loss) |
|
|
|
$ |
27.0 |
|
|
|
$ |
(645.0 |
) |
|
|
|
|
|
|
|
|
|
|
|
|
|
|
|
|
|
|
|
|
|
|
|
|
|
|
|
Basic net income (loss) per share |
|
|
|
$ |
0.35 |
|
|
|
$ |
(8.90 |
) |
|
|
|
|
|
|
|
|
|
|
|
|
|
|
|
|
|
|
|
|
|
|
|
|
|
|
|
Diluted net income (loss) per share |
|
|
|
$ |
0.34 |
|
|
|
$ |
(8.90 |
) |
|
|
|
|
|
|
|
|
|
|
|
|
|
|
|
|
|
|
|
|
|
|
|
|
|
|
|
Weighted average number of shares outstanding |
|
|
|
|
|
|
|
|
|
|
|
|
Basic |
|
|
|
|
77.2 |
|
|
|
|
72.5 |
|
|
|
|
|
|
|
|
|
|
|
|
|
|
|
Diluted |
|
|
|
|
78.3 |
|
|
|
|
72.5 |
|
|
|
|
|
|
|
|
|
|
|
|
|
|
|
|
|
|
|
|
|
|
|
|
|
|
|
7
Lear Corporation and Subsidiaries
Consolidated Statements of Operations
(In millions, except per share amounts)
|
|
|
|
|
Twelve Months Ended |
|
|
|
||||||
|
|
|
|
|
|
|
|
|
||||||
|
|
|
|
|
December 31, |
|
|
|
December 31, |
|
|
|
||
|
|
|
|
|
2007 |
|
|
|
2006 |
|
|
|
||
|
|
|
|
|
|
|
|
|
|
|
|
|
||
|
|
|
|
|
|
|
|
|
|
|
|
|
|
|
|
Net sales |
|
|
|
$ |
15,995.0 |
|
|
|
$ |
17,838.9 |
|
|
|
|
|
|
|
|
|
|
|
|
|
|
|
|
|
|
|
Cost of sales |
|
|
|
|
14,846.5 |
|
|
|
|
16,911.2 |
|
|
|
|
Selling, general and administrative expenses |
|
|
|
|
574.7 |
|
|
|
|
646.7 |
|
|
|
|
Goodwill impairment charge |
|
|
|
|
— |
|
|
|
|
2.9 |
|
|
|
|
Divestiture of Interior business |
|
|
|
|
10.7 |
|
|
|
|
636.0 |
|
|
|
|
Interest expense |
|
|
|
|
199.2 |
|
|
|
|
209.8 |
|
|
|
|
Other expense, net |
|
|
|
|
32.5 |
|
|
|
|
87.8 |
|
|
|
|
|
|
|
|
|
|
|
|
|
|
|
|
|
|
|
|
|
|
|
|
|
|
|
|
|
|
|
|
|
|
Income (loss) before income taxes and |
|
|
|
|
|
|
|
|
|
|
|
|
|
|
cumulative effect of a change in accounting principle |
|
|
|
|
331.4 |
|
|
|
|
(655.5 |
) |
|
|
|
Income tax provision |
|
|
|
|
89.9 |
|
|
|
|
54.9 |
|
|
|
|
|
|
|
|
|
|
|
|
|
|
|
|
|
|
|
|
|
|
|
|
|
|
|
|
|
|
|
|
|
|
Income (loss) before cumulative effect of a change in accounting principle |
|
|
|
|
241.5 |
|
|
|
|
(710.4 |
) |
|
|
|
|
|
|
|
|
|
|
|
|
|
|
|
|
|
|
Cumulative effect of a change in accounting principle |
|
|
|
|
— |
|
|
|
|
2.9 |
|
|
|
|
|
|
|
|
|
|
|
|
|
|
|
|
|
|
|
|
|
|
|
|
|
|
|
|
|
|
|
|
|
|
Net income (loss) |
|
|
|
$ |
241.5 |
|
|
|
$ |
(707.5 |
) |
|
|
|
|
|
|
|
|
|
|
|
|
|
|
|
|
|
|
|
|
|
|
|
|
|
|
|
|
|
|
|
|
|
|
|
|
|
|
|
|
|
|
|
|
|
|
|
|
Basic net income (loss) per share |
|
|
|
|
|
|
|
|
|
|
|
|
|
|
Income (loss) before cumulative effect of a change in accounting principle |
|
|
|
$ |
3.14 |
|
|
|
$ |
(10.35 |
) |
|
|
|
Cumulative effect of a change in accounting principle |
|
|
|
|
— |
|
|
|
|
0.04 |
|
|
|
|
|
|
|
|
|
|
|
|
|
|
|
|
|
|
|
Basic net income (loss) per share |
|
|
|
$ |
3.14 |
|
|
|
$ |
(10.31 |
) |
|
|
|
|
|
|
|
|
|
|
|
|
|
|
|
|
|
|
|
|
|
|
|
|
|
|
|
|
|
|
|
|
|
|
|
|
|
|
|
|
|
|
|
|
|
|
|
|
Diluted net income (loss) per share |
|
|
|
|
|
|
|
|
|
|
|
|
|
|
Income (loss) before cumulative effect of a change in accounting principle |
|
|
|
$ |
3.09 |
|
|
|
$ |
(10.35 |
) |
|
|
|
Cumulative effect of a change in accounting principle |
|
|
|
|
— |
|
|
|
|
0.04 |
|
|
|
|
|
|
|
|
|
|
|
|
|
|
|
|
|
|
|
Diluted net income (loss) per share |
|
|
|
$ |
3.09 |
|
|
|
$ |
(10.31 |
) |
|
|
|
|
|
|
|
|
|
|
|
|
|
|
|
|
|
|
|
|
|
|
|
|
|
|
|
|
|
|
|
|
|
Weighted average number of shares outstanding |
|
|
|
|
|
|
|
|
|
|
|
|
|
|
Basic |
|
|
|
|
76.8 |
|
|
|
|
68.6 |
|
|
|
|
|
|
|
|
|
|
|
|
|
|
|
|
|
|
|
Diluted |
|
|
|
|
78.2 |
|
|
|
|
68.6 |
|
|
|
|
|
|
|
|
|
|
|
|
|
|
|
|
|
|
8
Lear Corporation and Subsidiaries
Consolidated Balance Sheets
(In millions)
|
|
|
|
|
December 31, |
|
|
|
December 31, |
|
||
|
|
|
|
|
2007 |
|
|
|
2006 |
|
||
|
|
|
|
|
|
|
|
|
|
|
||
|
ASSETS |
|
|
|
|
|
|
|
|
|
|
|
|
Current: |
|
|
|
|
|
|
|
|
|
|
|
|
Cash and cash equivalents |
|
|
|
$ |
601.3 |
|
|
|
$ |
502.7 |
|
|
Accounts receivable |
|
|
|
|
2,147.6 |
|
|
|
|
2,006.9 |
|
|
Inventories |
|
|
|
|
605.5 |
|
|
|
|
581.5 |
|
|
Current assets of business held for sale |
|
|
|
|
— |
|
|
|
|
427.8 |
|
|
Other |
|
|
|
|
363.6 |
|
|
|
|
371.4 |
|
|
|
|
|
|
|
|
|
|
|
|
|
|
|
|
|
|
|
|
3,718.0 |
|
|
|
|
3,890.3 |
|
|
|
|
|
|
|
|
|
|
|
|
|
|
|
Long-Term: |
|
|
|
|
|
|
|
|
|
|
|
|
PP&E, net |
|
|
|
|
1,392.7 |
|
|
|
|
1,471.7 |
|
|
Goodwill, net |
|
|
|
|
2,054.0 |
|
|
|
|
1,996.7 |
|
|
Other |
|
|
|
|
635.7 |
|
|
|
|
491.8 |
|
|
|
|
|
|
|
|
|
|
|
|
|
|
|
|
|
|
|
|
4,082.4 |
|
|
|
|
3,960.2 |
|
|
|
|
|
|
|
|
|
|
|
|
|
|
|
|
|
|
|
|
|
|
|
|
|
|
|
|
Total Assets |
|
|
|
$ |
7,800.4 |
|
|
|
$ |
7,850.5 |
|
|
|
|
|
|
|
|
|
|
|
|
|
|
|
|
|
|
|
|
|
|
|
|
|
|
|
|
|
|
|
|
|
|
|
|
|
|
|
|
|
LIABILITIES AND STOCKHOLDERS’ EQUITY |
|
|
|
|
|
|
|
|
|
|
|
|
Current: |
|
|
|
|
|
|
|
|
|
|
|
|
Short-term borrowings |
|
|
|
$ |
13.9 |
|
|
|
$ |
39.3 |
|
|
Accounts payable and drafts |
|
|
|
|
2,263.8 |
|
|
|
|
2,317.4 |
|
|
Accrued liabilities |
|
|
|
|
1,230.1 |
|
|
|
|
1,099.3 |
|
|
Current liabilities of business held for sale |
|
|
|
|
— |
|
|
|
|
405.7 |
|
|
Current portion of long-term debt |
|
|
|
|
96.1 |
|
|
|
|
25.6 |
|
|
|
|
|
|
|
|
|
|
|
|
|
|
|
|
|
|
|
|
3,603.9 |
|
|
|
|
3,887.3 |
|
|
|
|
|
|
|
|
|
|
|
|
|
|
|
Long-Term: |
|
|
|
|
|
|
|
|
|
|
|
|
Long-term debt |
|
|
|
|
2,344.6 |
|
|
|
|
2,434.5 |
|
|
Long-term liabilities of business held for sale |
|
|
|
|
— |
|
|
|
|
48.5 |
|
|
Other |
|
|
|
|
761.2 |
|
|
|
|
878.2 |
|
|
|
|
|
|
|
|
|
|
|
|
|
|
|
|
|
|
|
|
3,105.8 |
|
|
|
|
3,361.2 |
|
|
|
|
|
|
|
|
|
|
|
|
|
|
|
|
|
|
|
|
|
|
|
|
|
|
|
|
Stockholders’ Equity |
|
|
|
|
1,090.7 |
|
|
|
|
602.0 |
|
|
|
|
|
|
|
|
|
|
|
|
|
|
|
|
|
|
|
|
|
|
|
|
|
|
|
|
Total Liabilities and Stockholders’ Equity |
|
|
|
$ |
7,800.4 |
|
|
|
$ |
7,850.5 |
|
|
|
|
|
|
|
|
|
|
|
|
|
|
|
|
|
|
|
|
|
|
|
|
|
|
|
9
Lear Corporation and Subsidiaries
Supplemental Data
(Unaudited; in millions, except content per vehicle and share data)
|
|
|
|
|
Three Months Ended |
|
|
|
||||||
|
|
|
|
|
|
|
|
|
||||||
|
|
|
|
|
December 31, |
|
|
|
December 31, |
|
|
|
||
|
|
|
|
|
2007 |
|
|
|
2006 |
|
|
|
||
|
|
|
|
|
|
|
|
|
|
|
|
|
||
|
Net Sales |
|
|
|
|
|
|
|
|
|
|
|
|
|
|
North America |
|
|
|
$ |
1,566.4 |
|
|
|
$ |
2,240.1 |
|
|
|
|
Europe |
|
|
|
|
1,781.0 |
|
|
|
|
1,591.8 |
|
|
|
|
Rest of World |
|
|
|
|
511.6 |
|
|
|
|
448.6 |
|
|
|
|
|
|
|
|
|
|
|
|
|
|
|
|
|
|
|
Total |
|
|
|
$ |
3,859.0 |
|
|
|
$ |
4,280.5 |
|
|
|
|
|
|
|
|
|
|
|
|
|
|
|
|
|
|
|
|
|
|
|
|
|
|
|
|
|
|
|
|
|
|
Net Sales - Core Businesses |
|
|
|
|
|
|
|
|
|
|
|
|
|
|
North America |
|
|
|
$ |
1,566.4 |
|
|
|
$ |
1,673.0 |
|
|
|
|
Europe |
|
|
|
|
1,781.0 |
|
|
|
|
1,530.1 |
|
|
|
|
Rest of World |
|
|
|
|
511.6 |
|
|
|
|
439.4 |
|
|
|
|
|
|
|
|
|
|
|
|
|
|
|
|
|
|
|
Total |
|
|
|
$ |
3,859.0 |
|
|
|
$ |
3,642.5 |
|
|
|
|
|
|
|
|
|
|
|
|
|
|
|
|
|
|
|
|
|
|
|
|
|
|
|
|
|
|
|
|
|
|
Content Per Vehicle* |
|
|
|
|
|
|
|
|
|
|
|
|
|
|
North America |
|
|
|
$ |
431 |
|
|
|
$ |
621 |
|
|
|
|
North America - core businesses |
|
|
|
$ |
431 |
|
|
|
$ |
463 |
|
|
|
|
Europe |
|
|
|
$ |
355 |
|
|
|
$ |
333 |
|
|
|
|
Europe - core businesses |
|
|
|
$ |
355 |
|
|
|
$ |
320 |
|
|
|
|
|
|
|
|
|
|
|
|
|
|
|
|
|
|
|
Free Cash Flow** |
|
|
|
|
|
|
|
|
|
|
|
|
|
|
Net cash provided by operating activities |
|
|
|
$ |
157.4 |
|
|
|
$ |
179.2 |
|
|
|
|
Net change in sold accounts receivable |
|
|
|
|
101.6 |
|
|
|
|
154.3 |
|
|
|
|
|
|
|
|
|
|
|
|
|
|
|
|
|
|
|
Net cash provided by operating activities before |
|
|
|
|
|
|
|
|
|
|
|
|
|
|
net change in sold accounts receivable |
|
|
|
|
259.0 |
|
|
|
|
333.5 |
|
|
|
|
Capital expenditures |
|
|
|
|
(88.1 |
) |
|
|
|
(79.1 |
) |
|
|
|
|
|
|
|
|
|
|
|
|
|
|
|
|
|
|
Free cash flow |
|
|
|
$ |
170.9 |
|
|
|
$ |
254.4 |
|
|
|
|
|
|
|
|
|
|
|
|
|
|
|
|
|
|
|
|
|
|
|
|
|
|
|
|
|
|
|
|
|
|
Depreciation and Amortization |
|
|
|
$ |
76.0 |
|
|
|
$ |
92.8 |
|
|
|
|
|
|
|
|
|
|
|
|
|
|
|
|
|
|
|
Core Operating Earnings** |
|
|
|
|
|
|
|
|
|
|
|
|
|
|
Pretax income (loss) |
|
|
|
$ |
45.1 |
|
|
|
$ |
(635.9 |
) |
|
|
|
Interest expense |
|
|
|
|
48.9 |
|
|
|
|
52.3 |
|
|
|
|
Other (income) expense, net |
|
|
|
|
(10.3 |
) |
|
|
|
14.1 |
|
|
*** |
|
Restructuring costs and other special items - |
|
|
|
|
|
|
|
|
|
|
|
|
|
|
Divestiture of Interior business |
|
|
|
|
2.9 |
|
|
|
|
607.3 |
|
|
|
|
Fixed asset impairment charges related to Interior business |
|
|
|
|
— |
|
|
|
|
0.8 |
|
|
|
|
Costs related to restructuring actions |
|
|
|
|
93.9 |
|
|
|
|
42.5 |
|
|
|
|
Costs related to merger transaction |
|
|
|
|
(1.9 |
) |
|
|
|
— |
|
|
|
|
Loss on extinguishment of debt |
|
|
|
|
— |
|
|
|
|
48.5 |
|
|
|
|
Less: Interior business |
|
|
|
|
— |
|
|
|
|
31.5 |
|
|
|
|
|
|
|
|
|
|
|
|
|
|
|
|
|
|
|
Core operating earnings |
|
|
|
$ |
178.6 |
|
|
|
$ |
161.1 |
|
|
|
|
|
|
|
|
|
|
|
|
|
|
|
|
|
|
|
|
|
|
|
|
|
|
|
|
|
|
|
|
|
|
* |
Content Per Vehicle for 2006 has been updated to reflect actual production levels. |
|
** |
See “Non-GAAP Financial Information” included in this press release. |
|
*** |
Reported 2006 other expense, net of $61.1 million includes losses of $47.0 million related to restructuring costs and other special items detailed above. |
10
Lear Corporation and Subsidiaries
Supplemental Data
(Unaudited; in millions, except content per vehicle and share data)
|
|
|
|
|
Twelve Months Ended |
|
|
||||||
|
|
|
|
|
|
|
|
||||||
|
|
|
|
|
December 31, |
|
|
|
December 31, |
|
|
||
|
|
|
|
|
2007 |
|
|
|
2006 |
|
|
||
|
|
|
|
|
|
|
|
|
|
|
|
||
|
|
|
Net Sales |
|
|
|
|
|
|
|
|
|
|
|
|
|
North America |
|
$ |
7,260.4 |
|
|
|
$ |
9,840.9 |
|
|
|
|
|
Europe |
|
|
6,895.1 |
|
|
|
|
6,426.2 |
|
|
|
|
|
Rest of World |
|
|
1,839.5 |
|
|
|
|
1,571.8 |
|
|
|
|
|
|
|
|
|
|
|
|
|
|
|
|
|
|
|
Total |
|
$ |
15,995.0 |
|
|
|
$ |
17,838.9 |
|
|
|
|
|
|
|
|
|
|
|
|
|
|
|
|
|
|
|
|
|
|
|
|
|
|
|
|
|
|
|
|
|
Net Sales — Core Businesses |
|
|
|
|
|
|
|
|
|
|
|
|
|
North America |
|
$ |
6,648.4 |
|
|
|
$ |
7,297.3 |
|
|
|
|
|
Europe |
|
|
6,827.1 |
|
|
|
|
5,785.7 |
|
|
|
|
|
Rest of World |
|
|
1,830.6 |
|
|
|
|
1,538.7 |
|
|
|
|
|
|
|
|
|
|
|
|
|
|
|
|
|
|
|
Total |
|
$ |
15,306.1 |
|
|
|
$ |
14,621.7 |
|
|
|
|
|
|
|
|
|
|
|
|
|
|
|
|
|
|
|
|
|
|
|
|
|
|
|
|
|
|
|
|
|
Content Per Vehicle * |
|
|
|
|
|
|
|
|
|
|
|
|
|
North America |
|
$ |
484 |
|
|
|
$ |
645 |
|
|
|
|
|
North America — core businesses |
|
$ |
443 |
|
|
|
$ |
478 |
|
|
|
|
|
Europe |
|
$ |
344 |
|
|
|
$ |
338 |
|
|
|
|
|
Europe — core businesses |
|
$ |
341 |
|
|
|
$ |
304 |
|
|
|
|
|
|
|
|
|
|
|
|
|
|
|
|
|
|
|
Free Cash Flow ** |
|
|
|
|
|
|
|
|
|
|
|
|
|
Net cash provided by operating activities |
|
$ |
466.9 |
|
|
|
$ |
285.3 |
|
|
|
|
|
Net change in sold accounts receivable |
|
|
168.9 |
|
|
|
|
178.0 |
|
|
|
|
|
|
|
|
|
|
|
|
|
|
|
|
|
|
|
Net cash provided by operating activities before |
|
|
|
|
|
|
|
|
|
|
|
|
|
net change in sold accounts receivable |
|
|
635.8 |
|
|
|
|
463.3 |
|
|
|
|
|
Capital expenditures |
|
|
(202.2 |
) |
|
|
|
(347.6 |
) |
|
|
|
|
|
|
|
|
|
|
|
|
|
|
|
|
|
|
Free cash flow |
|
$ |
433.6 |
|
|
|
$ |
115.7 |
|
|
|
|
|
|
|
|
|
|
|
|
|
|
|
|
|
|
|
|
|
|
|
|
|
|
|
|
|
|
|
|
|
Depreciation and Amortization |
|
$ |
296.9 |
|
|
|
$ |
392.2 |
|
|
|
|
|
|
|
|
|
|
|
|
|
|
|
|
|
|
|
Basic Shares Outstanding at end of year |
|
|
77,189,965 |
|
|
|
|
76,251,990 |
|
|
|
|
|
|
|
|
|
|
|
|
|
|
|
|
|
|
|
Diluted Shares Outstanding at end of year *** |
|
|
78,159,822 |
|
|
|
|
76,251,990 |
|
|
|
|
|
|
|
|
|
|
|
|
|
|
|
|
|
* |
Content Per Vehicle for 2006 has been updated to reflect actual production levels. |
|
** |
See “Non-GAAP Financial Information” included in this press release. |
|
*** |
Calculated using stock price at end of quarter. Excludes certain shares related to outstanding convertible debt, as well as certain options, restricted stock units, performance units and stock appreciation rights, all of which were antidilutive. |
11
Lear Corporation and Subsidiaries
Supplemental Data
(Unaudited; in
millions, except content per vehicle and share data)
|
|
|
|
|
Twelve Months Ended |
|
|
|
||||||
|
|
|
|
|
|
|
|
|
||||||
|
|
|
|
|
December 31, |
|
|
|
December 31, |
|
|
|
||
|
|
|
|
|
2007 |
|
|
|
2006 |
|
|
|
||
|
|
|
|
|
|
|
|
|
|
|
|
|
||
|
Core Operating Earnings * |
|
|
|
|
|
|
|
|
|
|
|
|
|
|
Pretax income (loss) |
|
|
|
$ |
331.4 |
|
|
|
$ |
(655.5 |
) |
|
|
|
Interest expense |
|
|
|
|
199.2 |
|
|
|
|
209.8 |
|
|
|
|
Other expense, net |
|
|
|
|
28.6 |
|
|
** |
|
72.1 |
|
|
** |
|
Restructuring costs and other special items - |
|
|
|
|
|
|
|
|
|
|
|
|
|
|
Costs related to divestiture of Interior business |
|
|
|
|
20.7 |
|
|
|
|
636.0 |
|
|
|
|
Fixed asset impairment charges related to Interior business |
|
|
|
|
— |
|
|
|
|
10.0 |
|
|
|
|
Goodwill impairment charge related to Interior business |
|
|
|
|
— |
|
|
|
|
2.9 |
|
|
|
|
Costs related to restructuring actions |
|
|
|
|
181.8 |
|
|
|
|
99.7 |
|
|
|
|
U.S. salaried pension plan curtailment gain |
|
|
|
|
(36.4 |
) |
|
|
|
— |
|
|
|
|
Costs related to merger transaction |
|
|
|
|
34.9 |
|
|
|
|
— |
|
|
|
|
Loss on extinguishment of debt |
|
|
|
|
— |
|
|
|
|
48.5 |
|
|
|
|
(Gain) loss on joint venture transactions |
|
|
|
|
3.9 |
|
|
|
|
(26.9 |
) |
|
|
|
Less: Interior business |
|
|
|
|
(15.6 |
) |
|
|
|
161.2 |
|
|
|
|
|
|
|
|
|
|
|
|
|
|
|
|
|
|
|
Core operating earnings |
|
|
|
$ |
748.5 |
|
|
|
$ |
557.8 |
|
|
|
|
|
|
|
|
|
|
|
|
|
|
|
|
|
|
|
|
|
|
|
|
|
|
|
|
|
|
|
|
|
|
Net Income excluding Restructuring Costs and |
|
|
|
|
|
|
|
|
|
|
|
|
|
|
Other Special Items * |
|
|
|
|
|
|
|
|
|
|
|
|
|
|
Net income (loss) |
|
|
|
$ |
241.5 |
|
|
|
$ |
(707.5 |
) |
|
|
|
Cumulative effect of a change in accounting principle |
|
|
|
|
— |
|
|
|
|
(2.9 |
) |
|
|
|
Restructuring costs and other special items - |
|
|
|
|
|
|
|
|
|
|
|
|
|
|
Costs related to divestiture of Interior business |
|
|
|
|
20.7 |
|
|
|
|
636.0 |
|
|
|
|
Fixed asset impairment charges related to Interior business |
|
|
|
|
— |
|
|
|
|
10.0 |
|
|
|
|
Goodwill impairment charge related to Interior business |
|
|
|
|
— |
|
|
|
|
2.9 |
|
|
|
|
Costs related to restructuring actions |
|
|
|
|
181.8 |
|
|
|
|
99.7 |
|
|
|
|
U.S. salaried pension plan curtailment gain |
|
|
|
|
(36.4 |
) |
|
|
|
— |
|
|
|
|
Costs related to merger transaction |
|
|
|
|
34.9 |
|
|
|
|
— |
|
|
|
|
Loss on extinguishment of debt |
|
|
|
|
— |
|
|
|
|
48.5 |
|
|
|
|
(Gain) loss on joint venture transactions |
|
|
|
|
3.9 |
|
|
|
|
(26.9 |
) |
|
|
|
Tax impact of special items and other net tax adjustments *** |
|
|
|
|
(36.8 |
) |
|
|
|
(51.2 |
) |
|
|
|
|
|
|
|
|
|
|
|
|
|
|
|
|
|
|
Adjusted net income |
|
|
|
$ |
409.6 |
|
|
|
$ |
8.6 |
|
|
|
|
|
|
|
|
|
|
|
|
|
|
|
|
|
|
|
Net income (loss) per share |
|
|
|
$ |
3.09 |
|
|
|
$ |
(10.31 |
) |
|
|
|
|
|
|
|
|
|
|
|
|
|
|
|
|
|
|
Adjusted net income per share |
|
|
|
$ |
5.24 |
|
|
|
$ |
0.12 |
|
|
|
|
|
|
|
|
|
|
|
|
|
|
|
|
|
|
|
|
|
|
|
|
|
|
|
|
|
|
|
|
|
|
* |
See “Non-GAAP Financial Information” included in this press release.
|
|
** |
Reported 2007 and 2006 other expense, net of $32.5 million and $87.8 million, respectively, include losses of $3.9 million and $15.7 million, respectively, related to restructuring costs and other special items detailed above.
|
|
*** |
Represents the tax effect of restructuring costs and other special items, as well as several discrete tax items. The identification of these tax items is judgmental in nature and their calculation is based on various assumptions and estimates. |
12
a d v a n c e r e l e n t l e s s l y ®
January 31, 2008
Fourth-Quarter and Full-Year 2007
Results/2008 Financial Outlook
Exhibit 99.2
Agenda
Fourth-Quarter and Full-Year 2007 Results/
2008 Financial Outlook
Matt Simoncini, SVP and Chief Financial Officer
Strategic Objectives / Electrical and Electronic
Business Review
Dan Ninivaggi, Executive Vice President
Business Assessment and Outlook
Jim Vandenberghe, Vice Chairman
Q and A Session
2

Fourth-Quarter and
Full-Year 2007 Results/
2008 Financial Outlook
3
2007 Results – Core Businesses
Financial Highlights*
Fourth-Quarter 2007
Net sales of $3.9 billion, up 6%
Core operating earnings of $179 million, up 11%
Free cash flow of $171 million
Full-Year 2007
Net sales of $15.3 billion, up 5%
Core operating earnings of $749 million, up 34%
Free cash flow of $434 million – best since 2003
Increased total Asian sales by 31% to $2.9 billion
Aggressive actions implemented to improve our cost structure
*
Core operating earnings represents income before interest, other expense, income taxes, restructuring costs and other special items, excluding the
divested Interior business. Pretax income for the fourth-quarter and full-year 2007 was $45.1 million and $331.4 million, respectively. Free cash flow
represents net cash provided by operating activities before net change in sold accounts receivable, less capital expenditures. Net cash provided by
operating activities for the fourth-quarter and full-year 2007 was $157.4 million and $466.9 million, respectively. Total Asian sales includes
consolidated and non-consolidated sales. Please see slides titled “Non-GAAP Financial Information” at the end of this presentation for further
information.
4
2007 Results
Fourth Quarter Industry Environment
Fourth Quarter
Fourth Quarter
2007
2007 vs. 2006
North American Production
Industry
3.6 mil
up 1%
Domestic Three
2.3 mil
down 2%
Lear’s Top 15 Platforms
1.0 mil
down 7%
European Production
Industry
5.0 mil
up 5%
Lear's Top 5 Customers
2.6 mil
up 4%
Key Commodities (Quarterly Average)
vs. Prior Quarter
Steel (Hot Rolled)
up 3%
down 5%
Copper
down 5%
up 2%
Crude Oil
up 21%
up 52%
5
2007 Results
Fourth Quarter Reported Financials
[in millions, except net income (loss) per share]
Fourth
Quarter 2007
Fourth
Quarter 2006
4Q '07
B/(W) 4Q '06
Net Sales
$3,859.0
$4,280.5
($421.5)
Income Before Interest, Other (Income)
Expense and Income Taxes*
$86.6
$84.8
$1.8
Pretax Income (Loss)
$45.1
($635.9)
$681.0
Net Income (Loss)
$27.0
($645.0)
$672.0
Net Income (Loss) Per Share
$0.34
($8.90)
$9.24
SG&A % of Net Sales
3.8%
3.6%
(0.2)
pts.
Interest Expense
$48.9
$52.3
$3.4
Depreciation / Amortization
$76.0
$92.8
$16.8
Other (Income) Expense, Net
($10.3)
$61.1
$71.4
6
* Please see slides titled “Non-GAAP Financial Information” at the end of this presentation for further information.
2007 Results
Fourth Quarter Restructuring/Special Items*
(in millions)
Reported Results
2007 Total Company
$ 86.6
Reported Results Include the Following Items:
COGS
SG&A
Costs related to restructuring actions
$ 93.9
90.4
$
3.5
$
Costs related to merger transaction
(1.9)
-
(1.9)
2007 Core Operating Earnings
178.6
$
2006 Core Operating Earnings
161.1
$
Income Statement Category
7
Fourth Quarter
Income Before Interest,
Other (Income) Expense
and Income Taxes
* Please see slides titled “Non-GAAP Financial Information” at the end of this presentation for further information.

2007 Results
Fourth Quarter Net Sales Changes and Margin Impact
Net Sales
Margin
Performance Factor
Change
Impact
Comments
(in millions)
Industry Production /
Platform Mix / Net Pricing
$ (178)
Negative
Unfavorable platform mix, primarily in
North America
Global New Business
156
Positive
Primarily outside of North America (Saturn
Vue - seating, Nissan Qashqai - seating
and electrical, Hyundai Veracruz - seating
and electrical)
F/X Translation
246
Neutral
Euro up 12%, Canadian dollar up 16%
Acquisition / Divestiture
(646)
Positive
Divestiture of Interior business
Performance
Positive
Favorable operating performance in core
businesses, including benefits from
restructuring actions and efficiency actions
8
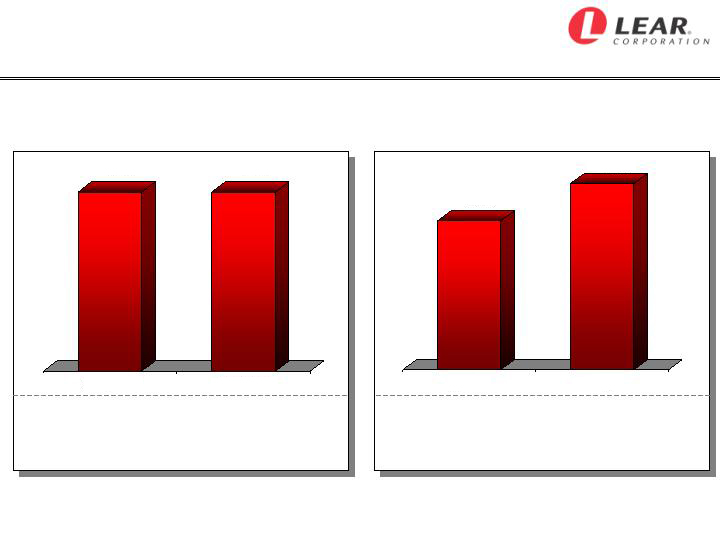
2007 Results – Seating Systems
Fourth Quarter and Full Year Performance*
5.6%
7.0%
Full Year
* Please see slides titled “Non-GAAP Financial Information” at the end of this presentation for further information.
Fourth Quarter
6.7%
6.7%
Q4 2006 Q4 2007
(in millions)
Sales
Earnings**
Adj. Earnings**
$2,903.2 $3,066.0
$ 181.0 $ 141.6
$ 194.9 $ 206.7
2006 2007
(in millions)
Sales
Earnings**
Adj. Earnings**
$11,624.8 $12,206.1
$ 604.0 $ 758.7
$ 645.7 $ 850.3
** Reported segment earnings represents income before interest, other expense and income taxes; adjusted earnings represents reported
segment earnings adjusted for restructuring costs and other special items.
Adjusted Seating Segment Margins
9
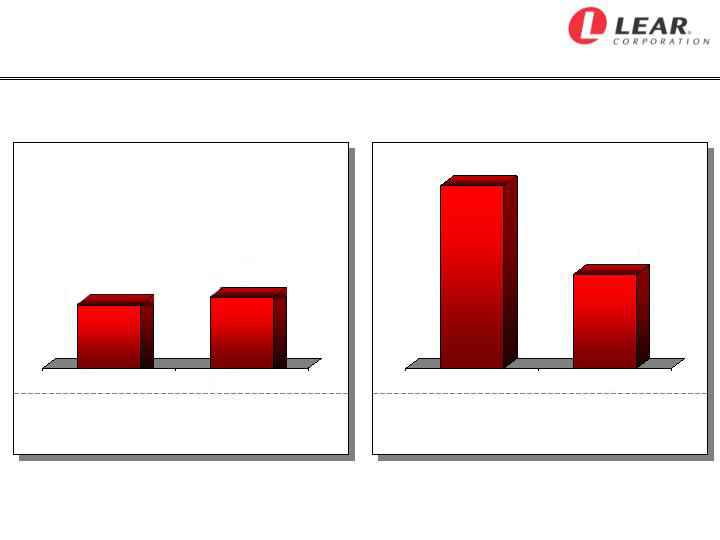
2007 Results – Electrical and Electronic
Fourth Quarter and Full Year Performance*
Full Year
4.9%
3.6%
2.4%
2.7%
Q4 2006
Q4 2007
Fourth Quarter
* Please see slides titled “Non-GAAP Financial Information” at the end of this presentation for further information.
2006 2007
(in millions)
Sales
Earnings**
Adj. Earnings**
$ 739.3 $ 793.0
$ (5.1) $ (4.2)
$ 17.7 $ 21.1
(in millions)
Sales
Earnings**
Adj. Earnings**
$2,996.9 $3,100.0
$ 102.5 $ 40.8
$ 147.3 $ 111.0
** Reported segment earnings represents income (loss) before interest, other expense and income taxes; adjusted earnings represents
reported segment earnings adjusted for restructuring costs and other special items.
Adjusted Electrical and Electronic Segment Margins
10
2007 Results
Fourth Quarter and Full Year Free Cash Flow*
* Free cash flow represents net cash provided by operating activities ($157.4 million for the three months and $466.9 million for the twelve
months ended 12/31/07) before net change in sold accounts receivable ($101.6 million for the three months and $168.9 million for the
twelve months ended 12/31/07) (Cash from Operations), less capital expenditures. Please see slides titled “Non-GAAP Financial
Information” at the end of this presentation for further information.
Fourth
Quarter 2007
Full Year
2007
Net Income
$ 27.0
$ 241.5
Depreciation / Amortization
76.0
296.9
Working Capital / Other
156.0
97.4
Cash from Operations
$ 259.0
$ 635.8
Capital Expenditures
(88.1)
(202.2)
Free Cash Flow
$ 170.9
$ 433.6
11
(in millions)
2008 Outlook
Full-Year Production Assumptions*
Full-Year
Change from
2008 Outlook
Prior Year
North American Production
Total Industry
~
~14.4 mil
down 4%
Domestic Three
~
~8.6 mil
down 9%
Lear’s Top 15 Platforms
~
~3.6 mil
down 12%
European Production
Total Industry
~
~20.1 mil
flat
Lear’s Top 5 Customers
~
~10.0 mil
down 2%
Euro
$1.45 / Euro
up 6%
12
* Please see slide titled “Forward-Looking Statements” at the end of this presentation for further information.
2008 Outlook
Full-Year Financial Forecast*
2008 Full-Year
Financial Forecast
Net Sales
˜ $15 billion
˜
Core Operating Earnings
$660 to $700 million
Income before interest, other expense,
income taxes, restructuring
costs and other special items
Interest Expense
$185 to $195 million
Pretax Income
$430 to $470 million
before restructuring costs
and other special items
Estimated Tax Expense
˜ $135 million
**
˜
Pretax Restructuring Costs
˜ $100 million
˜
Capital Spending
$255 to $275 million
Depreciation and Amortization
˜ $300 million
˜
Free Cash Flow
˜ $250 million or more
˜
13
* Please see slides titled “Non-GAAP Financial Information” and “Forward-Looking Statements” at the end of this presentation for
further information.
** Subject to actual mix of earnings by country.
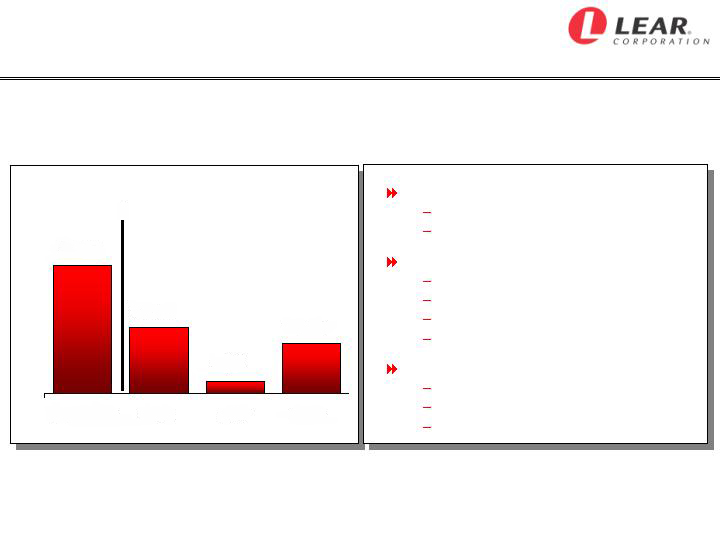
Sales Backlog Update*
2008 – 2010 Sales Backlog**
(in millions)
Composition of Sales Backlog**
* For a definition of sales backlog and the underlying backlog development assumptions, please see slide titled “Forward-Looking
Statements” at the end of this presentation.
** Consolidated sales only.
2008 – 2010 Non-Consolidated Backlog ~$300M
By Product:
Seating -- $205M
Electrical and Electronic -- $435M
By Region:
North America -- $(290)M
Europe -- $550M
Asia -- $280M
South America -- $100M
By Customer Type:
Domestic -- $(450)M
European -- $660M
Asia / Asian OEM -- $430M
14
~ $640
~
~ $330
~
~ $60
~
~ $250
~
2010
2009
2008
2008-2010

Strategic Objectives /
Electrical and Electronic
Business Review
15
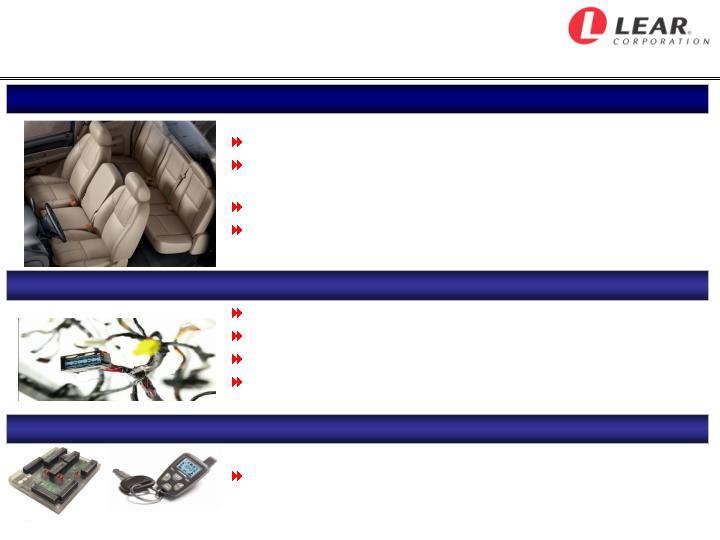
Strategic Objectives*
#1 market position in North America, Europe, China and India
Well-diversified sales mix – balanced customer, market and
platform representation
Selectively increased vertical integration in key components
Technology/technical solution leader in all key areas of
seating development and manufacturing
* Please see slide titled “Forward-Looking Statements” at the end of this presentation for further information.
Among top-tier wire harness suppliers globally
Diversified customer mix
Lowest-cost footprint
Technical expertise in high-voltage/low-voltage power distribution
architectures and system integration
Leadership Position in Seating
Achieve Critical Scale in Electrical Distribution
Grow Related Electronics
Leverage industry-leading junction box, wireless and related
electronic technology to substantially increase global sales
16
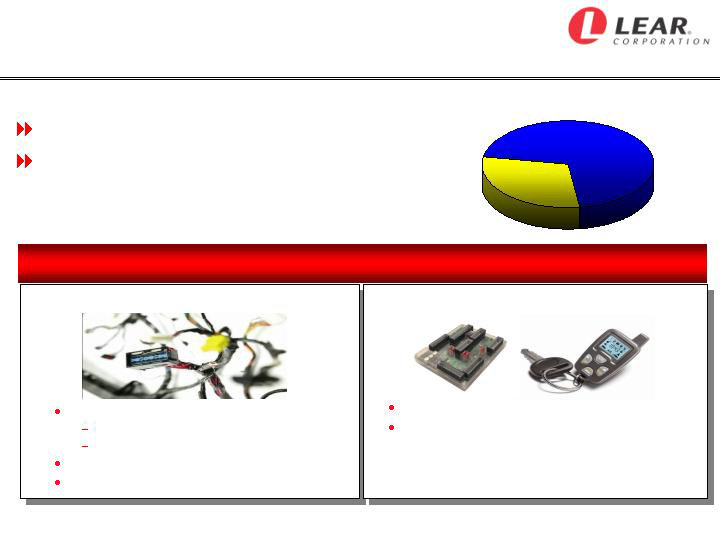
Electrical and Electronic
History and Business Profile
Sources: CSM Worldwide survey data / Lear estimates (based on independent suppliers)
Acquired from United Technologies in 1999
Present global sales of $3.1 billion
Electrical Distribution
$2.2 billion
Electronics
$0.9 billion
Electrical Distribution Systems
Business Profile
Electronic Products
Among leaders in wire harnesses:
#3 in North America
#4 in Europe
Proprietary terminals and connectors
Portfolio of hybrid electrical components
Leader in junction box technology
Niche player in electronic modules,
wireless products, premium audio/video
systems and tire pressure monitoring systems
17
Electrical and Electronic
Market Environment – Electrical Distribution
Highly competitive segment, presently
undergoing major restructuring and
consolidation
Global scale and low-cost footprint are
critical success factors
Market share and margin pressure as
top three wire harness suppliers expand
and defend their global positions
Leoni recently acquired Valeo’s wire
harness business
Electronic components business highly
fragmented and technology driven
1.
Yazaki
2.
Delphi
3.
Sumitomo
4.
Lear
5.
Leoni
Top-Five Wire Harness
Suppliers
Source: CSM Worldwide survey
data and Lear estimates
18
Electrical and Electronic
Market Opportunity*
External Factors
Power and signal distribution is a critical system in improving
vehicle functionality
Consumer demand for electronic content in vehicles is
continuing to increase
Emerging powertrain technologies (e.g., hybrid, fuel cell, etc.)
driving new high-content and high-voltage architectures
Lear Advantages
Existing customer relationships with all major automakers
Low-cost global footprint in electrical distribution
Technical capabilities in power and signal distribution
Expertise in overall system architecture and integration
Ability to adapt technologies into automotive applications
Solid Opportunity To Increase Shareholder Value
* Please see slide titled “Forward-Looking Statements” at the end of this presentation for further information.
19
Electrical and Electronic
Lear’s Improvement Plan*
Increase Global Scale
Sales backlog of $435 million through 2010; significant opportunity
for sales growth and diversification:
Pursue leadership position in wire harnesses
Scale industry-leading products globally (e.g., smart junction boxes)
Expand wireless products to Europe and Asia
Grow terminals and connectors
Participate in hybrid electrical growth
Continue rapid growth in Asia-Pacific region
Evaluate consolidation opportunities
Improve Cost Structure
Continue to expand low-cost engineering capabilities
Next low-cost phase is electronic components (3 new facilities in
2008 – Mexico, Eastern Europe and China)
Improved capacity utilization and cost absorption as new business
comes on-line
* Please see slide titled “Forward-Looking Statements” at the end of this presentation for further information.
20
Electrical and Electronic
Business Assessment by Region*
* Please see slide titled “Forward-Looking Statements” at the end of this presentation for further information.
North America [return to positive]
Presently underperforming, reflecting several lost programs and
ongoing transition of electronic components to low-cost countries
Sales backlog of $280 million coming on-line with further opportunity
Restructuring savings to increase in 2008 and beyond
Increased sourcing of low-cost components and engineering
Modest U.S. industry recovery
Europe [margin improves]
Sales backlog of $125 million coming on-line
Additional growth opportunities
Further improvement of low-cost footprint
Asia [profitable growth]
Continued solid performance, led by growth in China
Further leverage low-cost Asian footprint
21
Electrical and Electronic
Outlook for Business*
Significant new business coming on-line
Competitive low-cost footprint globally
Improved customer and geographic representation
Increased scale in electrical distribution, smart junction
boxes, wireless products and other electronic
components
Strong, complementary business to seating
Focus On Profitable Growth
* Please see slide titled “Forward-Looking Statements” at the end of this presentation for further information.
22

Business Assessment
and Outlook
23

Business Assessment
Lear has implemented a number of significant actions to
reposition its business for future success and improved
shareholder value
Despite challenging business conditions, we are continuing
to improve our financial results and strengthen our balance
sheet
We are continuing to diversify our global sales – last year,
55% of our revenue was generated outside of North America
Priority focus on delivering superior quality and customer
service continues
Seating business is performing well; actions are being
implemented to improve the Electrical and Electronic
business
24
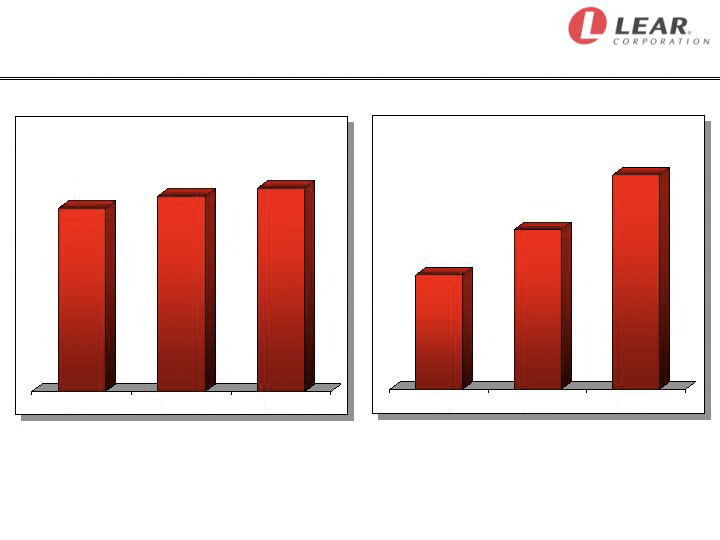
Net Sales*
*
Excludes Interior business:
- 2005 -- $3.1 billion
- 2006 -- $3.2 billion
- 2007 -- $0.7 billion
(in billions)
$14.0
$14.6
$15.3
2005
2006
2007
$749
$558
$401
2005
2006
2007
(in millions)
Core Operating Earnings*
Since 2005, Lear Has . . .
Improved Net Sales And Core Operating Earnings**
* Excludes Interior business:
- 2005 -- $(77) million
- 2006 -- $(161) million
- 2007 -- $16 million
** Core operating earnings represents income before interest, other expense, income taxes, restructuring costs and other special items, excluding the
divested Interior business. Pretax income (loss) was ($1,187.2) million, ($655.5) million and $331.4 million in 2005, 2006 and 2007, respectively.
Please see slides titled “Non-GAAP Financial Information” and “Forward-Looking Statements” at the end of this presentation for further information.
25
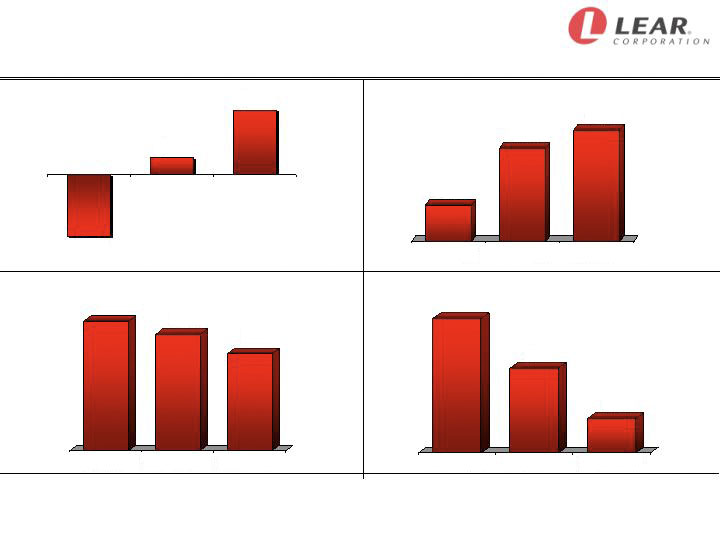
Restored Free Cash Flow and
Strengthened Our Balance Sheet*
Net Debt**
(in billions)
Cash Balance
(in millions)
$434
$116
($419)
$601
$503
$197
12/31/2005
12/31/2006
12/31/2007
$406
$256
$104
12/31/2005
12/31/2006
12/31/2007
$2.5
$2.3
$2.0
12/31/2007
12/31/2006
12/31/2005
ABS and Factoring Balances
(in millions)
* Please see slides titled “Non-GAAP Financial Information” at the end of this presentation for further information.
** Net debt represents total debt plus utilization under the Company’s securitization
and factoring facilities, less cash and cash equivalents. Total reported debt was
$2,275.9 million, $2,499.4 million and $2,454.6 million as of December 31, 2005, 2006 and 2007,
respectively. Free cash flow represents net cash provided by
operating activities before the net change in sold accounts receivable, less capital
expenditures. Net cash provided by operating activities was $560.8, $285.3 million
and $466.9 million for the years ended December 31, 2005, 2006 and 2007, respectively.
2005
2006
2007
Free Cash Flow**
(in millions)
26
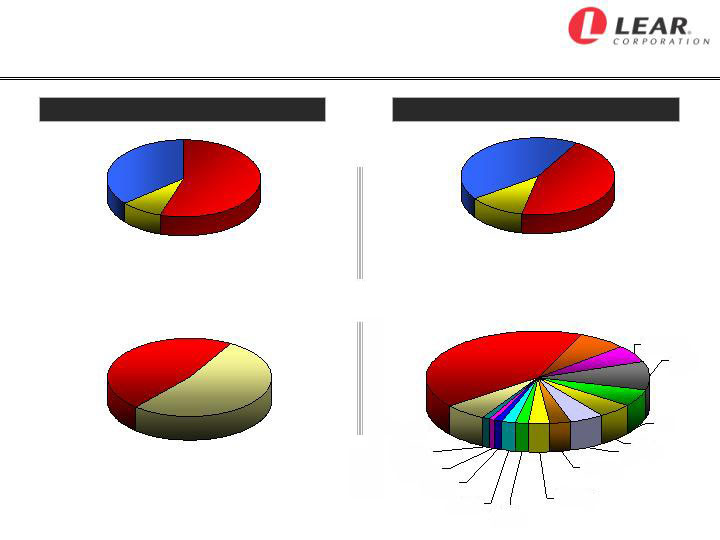
North America
45%
Europe
43%
Rest of World
12%
Europe
36%
North America
55%
Geographic
Continuing To Diversify Our Sales Mix
Classic Ford & GM
47%
All Other
53%
Saab, Volvo,
Jaguar and Land Rover
7%
Classic Ford & GM
42%
Customer
2006
2007
Rest of World
9%
Chrysler 6%
BMW
Fiat
PSA
VW
Daimler
Hyundai
Mazda
Nissan
Toyota
Renault
Porsche
All Other
27
Summary and Outlook*
2007 represents second consecutive year of financial improvement:
Net sales in core business of $15.3 billion, up 5%
Core operating earnings of $749 million, up 34%
Free cash flow of $434 million – best since 2003
No significant near-term debt maturities
Business structure improvements being aggressively implemented to
improve long-term competitiveness:
Divested Interior business; retained minority interest
Aggressive actions to improve cost structure since 2005
Expanding in Asia-Pacific and growing Asian sales globally
Implementing actions to profitably grow our Electrical and Electronic
business
2008 outlook solid, despite sharply lower N.A. production
Longer-term financial outlook continues to be positive
* Please see slides titled “Non-GAAP Financial Information” and “Forward-Looking Statements” at the end of this presentation for further
information.
28
ADVANCE RELENTLESSLY™
www.lear.com
LEA
NYSE
Listed
R
29

In addition to the results reported in accordance with accounting principles generally accepted in the United States (“GAAP”) included throughout this
presentation, the Company has provided information regarding “income before interest, other (income) expense and income taxes,” “income before
interest, other (income) expense, income taxes, restructuring costs and other special items, excluding the divested Interior business” (core operating
earnings), “pretax income before restructuring costs and other special items,” “free cash flow” and “net debt” (each, a non-GAAP financial measure).
Other (income) expense includes, among other things, state and
local non-income taxes, foreign exchange gains and losses, fees associated with the
Company’s asset-backed securitization and factoring facilities, minority interests in consolidated subsidiaries, equity in net income of affiliates and gains
and losses on the sale of assets. Free cash flow represents net cash provided by operating activities before the net change in sold accounts receivable,
less capital expenditures. The Company believes it is appropriate to exclude the net change in sold accounts receivable in the calculation of free cash
flow since the sale of receivables may be viewed as a substitute for borrowing activity. Net debt represents total debt plus utilization under the Company’s
securitization and factoring facilities, less cash and cash equivalents.
Management believes the non-GAAP financial measures used in this presentation are useful to both management and investors in their analysis of the
Company’s financial position and results of operations. In particular, management believes that income before interest, other (income) expense and
income taxes, core operating earnings and pretax income before restructuring costs and other special items are useful measures in assessing the
Company’s financial performance by excluding certain items (including those items that are included in other expense) that are not indicative of the
Company's core operating earnings or that may obscure trends useful in evaluating the Company’s continuing operating activities. Management also
believes that these measures are useful to both management and investors in
their analysis of the Company's results of operations and provide improved
comparability between fiscal periods. Management believes that free cash flow is useful to both management and investors in their analysis of the
Company’s ability to service and repay its debt. Management believes that net debt provides useful information regarding the Company’s financial
condition. Further, management uses these non-GAAP financial measures for planning and forecasting in future periods.
Income before interest, other (income) expense and income taxes, core operating earnings, pretax income before restructuring costs and other special
items, free cash flow and net debt should not be considered in isolation or as a substitute for pretax income (loss), net income (loss), cash provided by
operating activities, total debt or other balance sheet, income statement or cash flow statement data prepared in accordance with GAAP or as a measure
of profitability or liquidity. In addition, the calculation of free cash flow does not reflect cash used to service debt and therefore, does not reflect funds
available for investment or other discretionary uses. Also, these non-GAAP financial measures, as determined and presented by the Company, may not
be comparable to related or similarly titled measures reported by other companies.
Set forth on the following slides are reconciliations of these non-GAAP financial measures to the most directly comparable financial measures calculated
and presented in accordance with GAAP. Given the inherent uncertainty regarding special items, other (income) expense and the net change in sold
accounts receivable in any future period, a reconciliation of forward-looking financial measures to the most directly comparable financial measures
calculated and presented in accordance with GAAP is not feasible. The magnitude of these items, however, may be significant.
Non-GAAP Financial Information
30
Non-GAAP Financial Information
Core Operating Earnings
Three Months Ended
Full Year
(in millions)
Q4 2007
Q4 2006
2007
2006
2005
Pretax income (loss)
$ 45.1
$ (635.9)
$ 331.4
$ (655.5)
$ (1,187.2)
Divestiture of Interior business
2.9
607.3
10.7
636.0
-
Interest expense
48.9
52.3
199.2
209.8
183.2
Other (income) expense, net *
(10.3)
61.1
32.5
87.8
96.6
Income (loss) before interest, other (income)
expense and income taxes
$ 86.6
$ 84.8
$ 573.8
$ 278.1
$ (907.4)
Costs related to divestiture (COS and SG&A)
-
-
10.0
-
-
Costs related to restructuring actions
93.9
44.0
181.8
105.6
106.3
Costs related to merger transaction
(1.9)
-
34.9
-
-
U.S. salaried plan curtailment gain
-
-
(36.4)
-
-
Goodwill and fixed asset impairment charges
-
0.8
-
12.9
1,095.1
Litigation charges
-
-
-
-
30.5
Income before interest, other (income)
expense, income taxes, restructuring costs
and other special items
178.6
$
129.6
$
764.1
$
396.6
$
324.5
$
Less: Interior business
-
31.5
(15.6)
161.2
76.5
Income before interest, other (income) expense,
income taxes, restructuring costs and other
special items, excluding the divested
Interior business
$ 178.6
$ 161.1
$ 748.5
$ 557.8
$ 401.0
(core operating earnings)
* Includes minority interests in consolidated subsidiaries and equity in net income of affiliates.
31
Non-GAAP Financial Information
Segment Earnings Reconciliation
Three Months
Full Year
(in millions)
Q4 2007
Q4 2006
2007
2006
Seating
$ 141.6
$ 181.0
$ 758.7
$ 604.0
Electrical and electronic
(4.2)
(5.1)
40.8
102.5
Interior
-
(34.2)
8.2
(183.8)
Segment earnings
137.4
141.7
807.7
522.7
Corporate and geographic
headquarters and elimination of
intercompany activity
(50.8)
(56.9)
(233.9)
(241.7)
Income before goodwill impairment
charges, interest, other (income)
expense and income taxes
$ 86.6
$ 84.8
$ 573.8
$ 281.0
Goodwill impairment charges
-
-
-
2.9
Divestiture of Interior business
2.9
607.3
10.7
636.0
Interest expense
48.9
52.3
199.2
209.8
Other (income) expense, net
(10.3)
61.1
32.5
87.8
Pretax income (loss)
$ 45.1
$ (635.9)
$ 331.4
$ (655.5)
32
Non-GAAP Financial Information
Adjusted Segment Earnings
Three Months Q4 2007
Three Months Q4 2006
Electrical and
Electrical and
(in millions)
Seating
Electronic
Seating
Electronic
Sales
3,066.0
$
793.0
$
2,903.2
$
739.3
$
Segment earnings
141.6
$
(4.2)
$
181.0
$
(5.1)
$
Costs related to restructuring actions
65.1
25.3
13.9
22.8
Adjusted segment earnings
206.7
$
21.1
$
194.9
$
17.7
$
Full Year 2007
Full Year 2006
Electrical and
Electrical and
Seating
Electronic
Seating
Electronic
Sales
12,206.1
$
3,100.0
$
11,624.8
$
2,996.9
$
Segment earnings
758.7
$
40.8
$
604.0
$
102.5
$
Costs related to restructuring actions
91.6
70.2
41.7
44.8
Litigation charges
-
-
-
-
Adjusted segment earnings
850.3
$
111.0
$
645.7
$
147.3
$
33
Non-GAAP Financial Information
Cash from Operations and Free Cash Flow
Three Months
(in millions)
Q4 2007
Full Year 2007
Full Year 2006
Full Year 2005
Net cash provided by operating activities
157.4
$
466.9
$
285.3
$
560.8
$
Net change in sold accounts receivable
101.6
168.9
178.0
(411.1)
Net cash provided by operating activities
before net change in sold accounts
receivable
(cash from operations)
259.0
635.8
463.3
149.7
Capital expenditures
(88.1)
(202.2)
(347.6)
(568.4)
Free cash flow
170.9
$
433.6
$
115.7
$
(418.7)
$
34

Non-GAAP Financial Information
Net Debt
December 31,
(in millions)
2007
2006
2005
Short-term borrowings
13.9
$
39.3
$
23.4
$
Current portion of long-term debt
96.1
25.6
9.4
Long-term debt
2,344.6
2,434.5
2,243.1
Total debt
2,454.6
2,499.4
2,275.9
Utilization under ABS and A/R factoring facilities
103.5
256.3
406.2
Cash and cash equivalents
(601.3)
(502.7)
(197.3)
Net debt
1,956.8
$
2,253.0
$
2,484.8
$
35

Forward-Looking Statements
This presentation contains forward-looking statements within the meaning of the Private Securities Litigation Reform Act of 1995,
including statements regarding anticipated financial results and liquidity. Actual results may differ materially from anticipated results
as a result of certain risks and uncertainties, including but not limited to, general economic conditions in the markets in which the
Company operates, including changes in interest rates or currency exchange rates, the financial condition of the Company’s
customers or suppliers, fluctuations in the production of vehicles for which the Company is a supplier, changes in the Company’s
current vehicle production estimates, the loss of business with respect to, or the lack of commercial success of, a vehicle model
for
which the Company is a significant supplier, disruptions in the relationships with the Company’s suppliers, labor disputes involving
the Company or its significant customers or suppliers or that otherwise affect the Company, the Company’s ability to achieve cost
reductions that offset or exceed customer-mandated selling price reductions, the outcome of customer productivity negotiations, the
impact and timing of program launch costs, the costs, timing and success of restructuring actions, increases in the Company’s
warranty or product liability costs, risks associated with conducting business in foreign countries, competitive conditions impacting the
Company’s key customers and suppliers, the cost and availability of raw materials and energy, the Company’s ability to mitigate any
increases in raw material, energy and commodity costs, the outcome of legal or regulatory proceedings to which the Company is or
may become a party, unanticipated changes
in cash flow, including the Company’s ability to align its vendor payment terms with
those of its customers and other risks described from time to time in the Company’s Securities and Exchange Commission filings. In
particular, the Company’s financial outlook for 2008 is based on several factors, including the Company’s current vehicle production
and raw material pricing assumptions. The Company’s actual financial results could differ materially as a result of significant
changes in these factors.
This presentation also contains information on the Company’s sales backlog. The Company’s incremental sales backlog reflects:
anticipated net sales from formally awarded new programs and open replacement programs, less phased-out and cancelled
programs. The calculation of backlog does not reflect customer price reductions on existing or newly awarded programs. The
backlog may be impacted by various assumptions embedded in the calculation, including vehicle production levels on new and
replacement programs, foreign exchange rates and the timing of major program launches. Lear’s 2008 – 2010 sales backlog is
based on an exchange rate of $1.45/per Euro and the following industry production assumptions: in North America, 14.4 million
units
in 2008 and 15 million thereafter and in Europe, 20.1 million units in 2008 and 20 million thereafter.
The forward-looking statements in this presentation are made as of the date hereof, and the Company does not assume any
obligation to update, amend or clarify them to reflect events, new information or circumstances occurring after the date hereof.
36